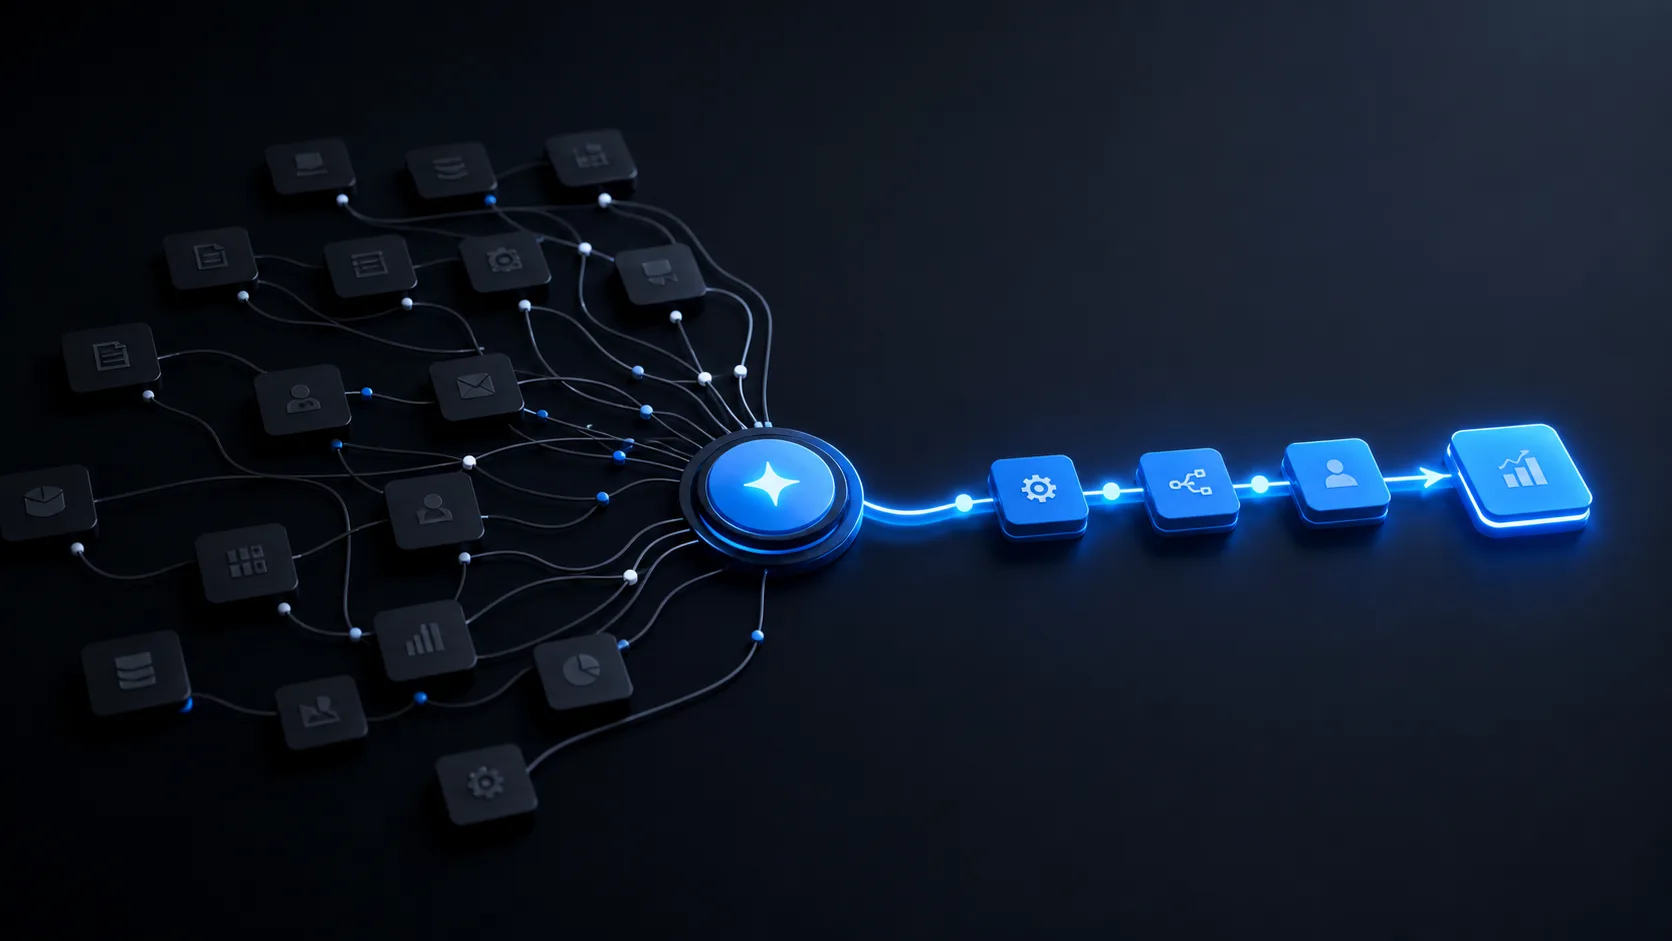

An operations dashboard should not be a decoration for leadership meetings. It should show where work is waiting, who owns the next action, which exception needs attention, and whether the operating system is improving.
Start with decisions
Before choosing charts, list the decisions the dashboard should support. Do we need to reassign work, unblock approvals, fix a process step, or understand why service delivery is slowing?
Measure flow, not only volume
Total tasks created is rarely enough. Leaders need throughput, waiting time, ageing work, rework, and blockers. These metrics reveal the difference between a busy team and a reliable operation.
Connect data to ownership
The dashboard should come from the workflow itself, not from manual weekly cleanup. OperationsFlow connects intake, status, owners, deadlines, escalation, and reporting so the numbers are tied to action.
If no one knows what to do after reading it, the dashboard is reporting noise, not operational visibility.
Frequently asked questions
What should an operations dashboard show?
It should show live work status, overdue actions, owners, cycle time, exceptions, and the metrics leaders can act on.
Why do dashboards fail?
Dashboards fail when they are built from manually cleaned data or show totals without ownership, deadlines, and next actions.
KODIA AI is a UAE-based business automation and AI systems company started in 2024, serving growing companies across the GCC and selected regional markets.
About KODIA →